Mathematical Quality Control (LISI & Silhouette)
Nasir Mahmood Abbasi, PhD
Bioinformatics Educator

Learning Objectives & Prerequisites
- Prerequisites: Complete scRNA-seq Basics and have a dataset with sample or batch labels and computed QC metrics.
- Objective: Use LISI and silhouette-style diagnostics to quantify batch mixing and biological separation without relying only on visual embeddings.
- Expected Output: A QC/integration evaluation table that reports metrics, neighborhood settings, labels, and a balanced interpretation.
Suggested route: use the Bioinformatics Learning Path to review any prerequisite stage before continuing.
Mathematical Quality Control for Integration & Clustering
The Problem with Subjective UMAPs
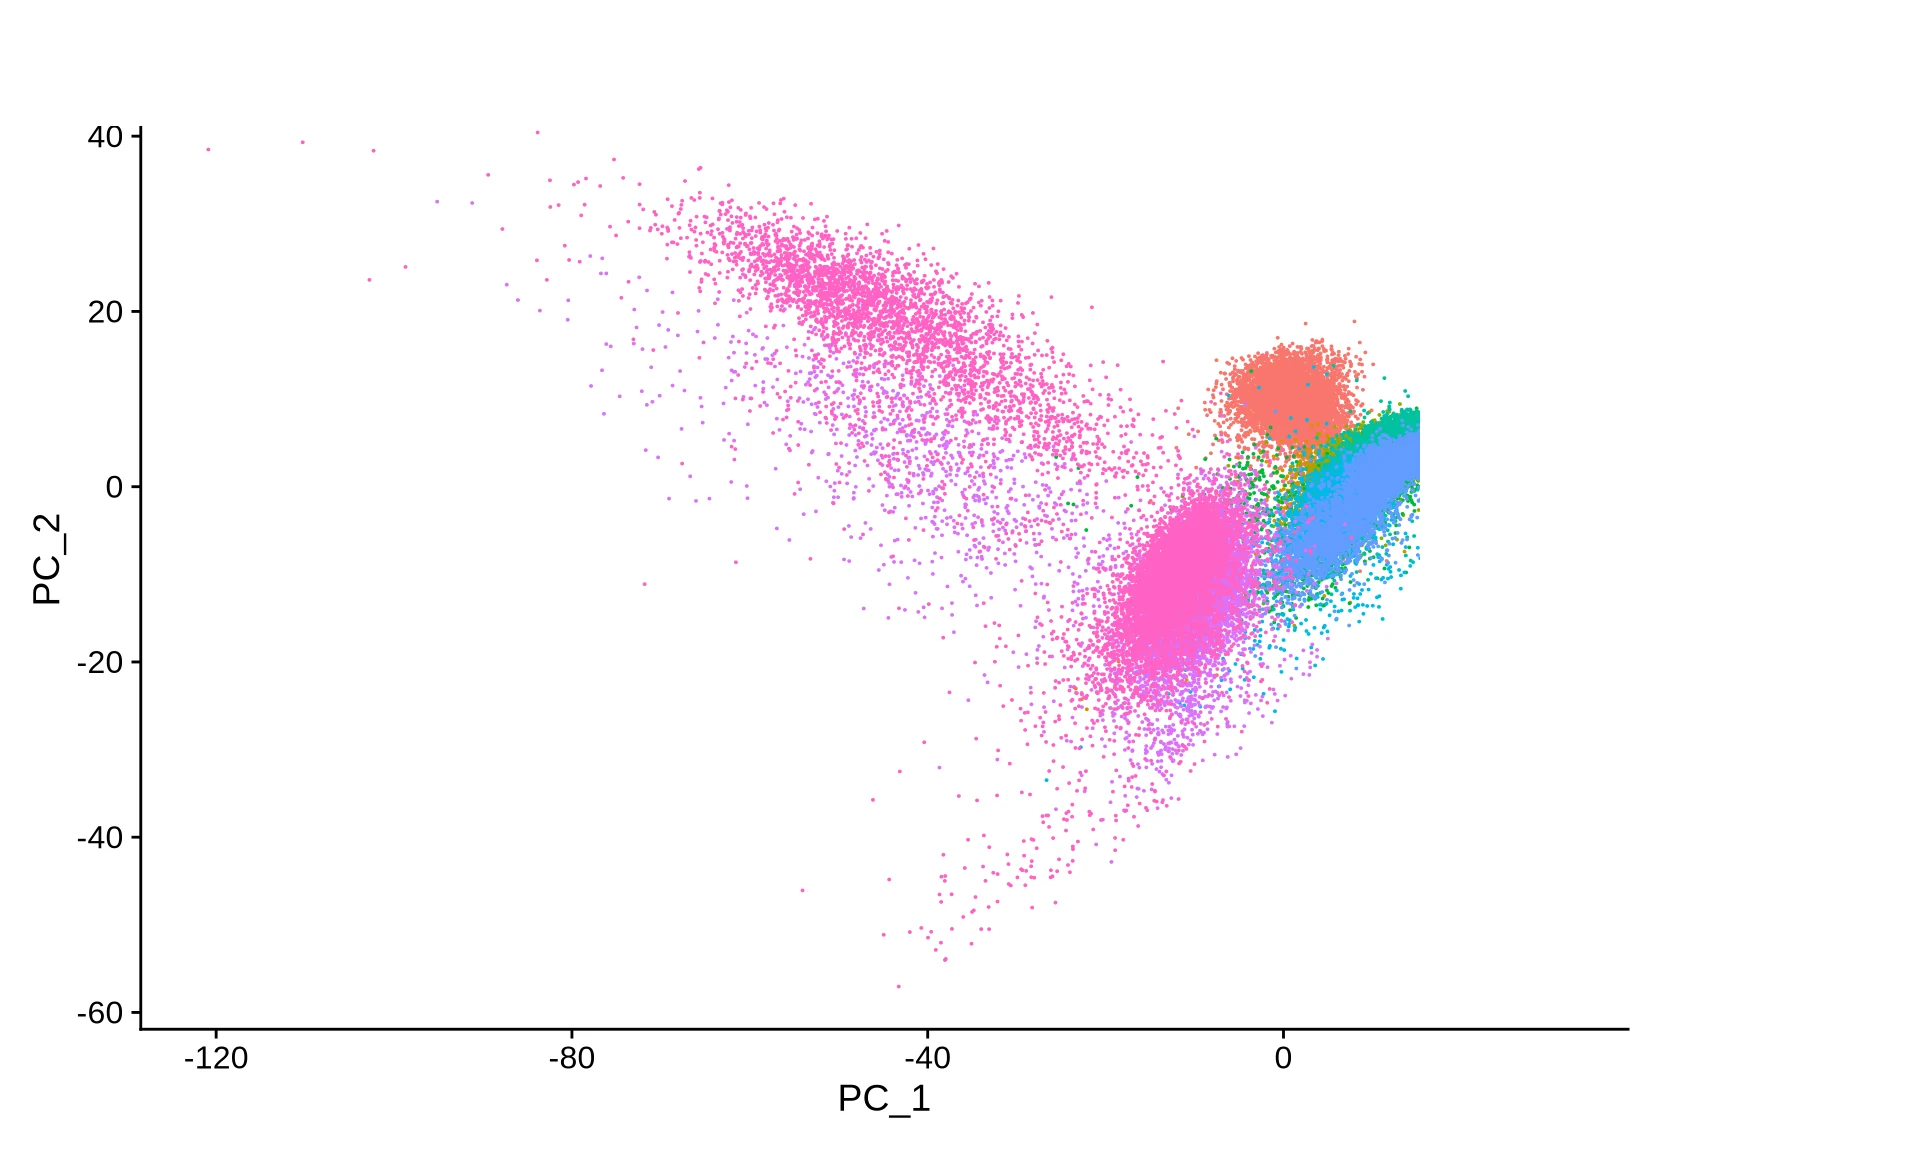
In single-cell RNA-seq, it is very common to run an integration algorithm (like Harmony or CCA) and assume it worked because the UMAP "looks mixed." However, high-impact journals require mathematical proof that batch effects were removed without destroying true biological variance.
This tutorial covers the two mathematical gold standards for validating integration and clustering.
1. Validating Batch Mixing with LISI
The Local Inverse Simpson's Index (LISI) mathematically quantifies how well different batches are mixed in your data.
There are two LISI metrics you must compute: 1. iLISI (Integration LISI): Measures how well batches are mixed. A score close to your total number of batches (e.g., if you have 4 patients, an iLISI of ~4) means perfect mixing. 2. cLISI (Cell-Type LISI): Measures how well cell types are separated. A score close to 1 means that a cell is surrounded only by its exact same cell type (perfect biological separation).
Running LISI in R
library(lisi)
library(Seurat)

# 1. Extract the mathematical embeddings (NOT the UMAP)
# UMAP is a 2D distortion. Always calculate metrics on PCA or Harmony space.
embeddings <- Embeddings(seurat_obj, reduction = "harmony")

# 2. Extract metadata
meta_data <- seurat_obj@meta.data

# 3. Compute LISI scores for batch (patient_id) and biology (cell_type)
lisi_res <- compute_lisi(embeddings, meta_data, c("patient_id", "cell_type"))

# 4. View results
# You want high values in the 'patient_id' column, and ~1.0 in the 'cell_type' column
summary(lisi_res)
2. Validating Cluster Robustness with Silhouette Scores
After you run FindClusters(), you need to know if the clusters you found are actually distinct biological entities, or if you simply "over-clustered" a single continuous cell type into arbitrary chunks.
A Silhouette Score calculates how similar a cell is to its own cluster compared to the next closest cluster. * Score > 0: The cell is well matched to its cluster. * Score < 0: The cell might belong to the neighboring cluster (over-clustering).
Calculating Silhouette Widths
library(cluster)

# 1. Calculate a Euclidean distance matrix on the PCA embeddings
dist_matrix <- dist(Embeddings(seurat_obj, reduction = "pca"))

# 2. Extract the cluster labels you generated
cluster_labels <- as.numeric(seurat_obj$seurat_clusters)

# 3. Compute Silhouette scores
sil <- silhouette(cluster_labels, dist_matrix)

# 4. Visualize the robustness
# A wide, positive silhouette for a cluster proves it is highly distinct
plot(sil, border = NA, col = "darkblue", main = "Cluster Silhouette Plot")
Conclusion
By calculating iLISI, cLISI, and Silhouette Scores, you bulletproof your analysis. Instead of saying "the cells appear to group together," you can objectively state in your manuscript: "Integration successfully removed batch effects (median iLISI = 3.8/4.0) while preserving cell-type separation (median cLISI = 1.02)."
Matched Python and R silhouette diagnostic
Calculate silhouette values on a specified high-dimensional representation rather than on a two-dimensional UMAP. Compare the score distribution across clusters and investigate negative values before changing resolution.
from sklearn.metrics import silhouette_samples, silhouette_score

embedding = adata.obsm["X_pca"]
labels = adata.obs["leiden"].astype(str)
adata.obs["silhouette"] = silhouette_samples(embedding, labels)
print(silhouette_score(embedding, labels))
library(cluster)

embedding <- Embeddings(seurat_obj, reduction = "pca")
labels <- as.numeric(factor(seurat_obj$seurat_clusters))
sil <- silhouette(labels, dist(embedding))
summary(sil[, "sil_width"])
Knowledge Check & Assessment
1. Concept Verification
Why can a high batch-mixing score be undesirable if cell identities or conditions are overcorrected?
2. Practical Execution
Calculate or inspect LISI and silhouette metrics for pre- and post-integration data, then explain the trade-off in one paragraph. Pass Criteria: Record the command or analysis choice, keep the output, and explain why it answers the stated task.
3. Troubleshooting
If metrics disagree with a UMAP, how will you check label choice, neighborhood parameters, class imbalance, and whether the expected biology was preserved?
Reviewed: July 2026
All commands and outputs were verified with the software versions listed in this tutorial. If you encounter reproducibility issues, please report them through the Contact page.
Author: Nasir Mahmood Abbasi, PhD · Category: Single-Cell RNA-seq