Quality Control Fundamentals
Nasir Mahmood Abbasi, PhD
Bioinformatics Educator

Quality control is not a decorative report added at the end of an analysis. It is the evidence used to decide whether data can support the biological question. This lesson introduces common QC measurements and how to act on them without applying arbitrary thresholds.
Learning Objectives & Prerequisites
By the end of this lesson, you should be able to:
- Explain read quality, mapping rate, duplication, coverage, contamination, and missingness.
- Separate technical failure from a genuine biological signal.
- Choose QC plots and thresholds appropriate to the assay.
- Document exclusions and retain the original data.
Prerequisites:
- Complete Biological Data Formats.
- Understand that thresholds depend on protocol, organism, platform, and study design.
By the end of this lesson, you should have: A QC summary that records the tool and version, key quality metrics, a pass-or-review decision, and the next action for the data.
1. Verify Download Integrity, Then Run Read-level QC
Before interpreting sequence quality, verify that each downloaded FASTQ file matches the checksum manifest provided by the archive or sequencing facility. A provider manifest contains the expected checksum for each exact filename. Do not use a checksum file you created only after an uncertain download as evidence that the original transfer was complete.
# Use the algorithm supplied by the data provider.
# SHA-256 manifest example:
sha256sum -c SHA256SUMS | tee checksum_validation.log

# Common sequencing-archive MD5 manifest example:
# md5sum -c md5checksums.txt | tee checksum_validation.log

# Confirm each compressed FASTQ stream can be read.
gzip -t sample_R1.fastq.gz sample_R2.fastq.gz
Proceed only when every required file reports OK and gzip -t returns no error. Save the provider manifest and checksum_validation.log under logs/; re-download any file that fails rather than editing the manifest.
For short reads, then inspect per-base quality, adapter content, sequence length, GC distribution, overrepresented sequences, and duplication. A low-quality tail may be trimmed, but trimming should be justified and recorded.
fastqc sample_R1.fastq.gz sample_R2.fastq.gz
multiqc .
2. Alignment and coverage QC
Mapping rate, properly paired reads, insert size, coverage depth, duplicate fraction, and target enrichment describe different failure modes. A high mapping rate does not guarantee correct alignment if the reference is wrong or contamination is present.
samtools flagstat aligned.bam
samtools idxstats aligned.bam | head
samtools depth -a aligned.bam | awk "{sum+=\$3} END {print sum/NR}"
3. Single-cell QC
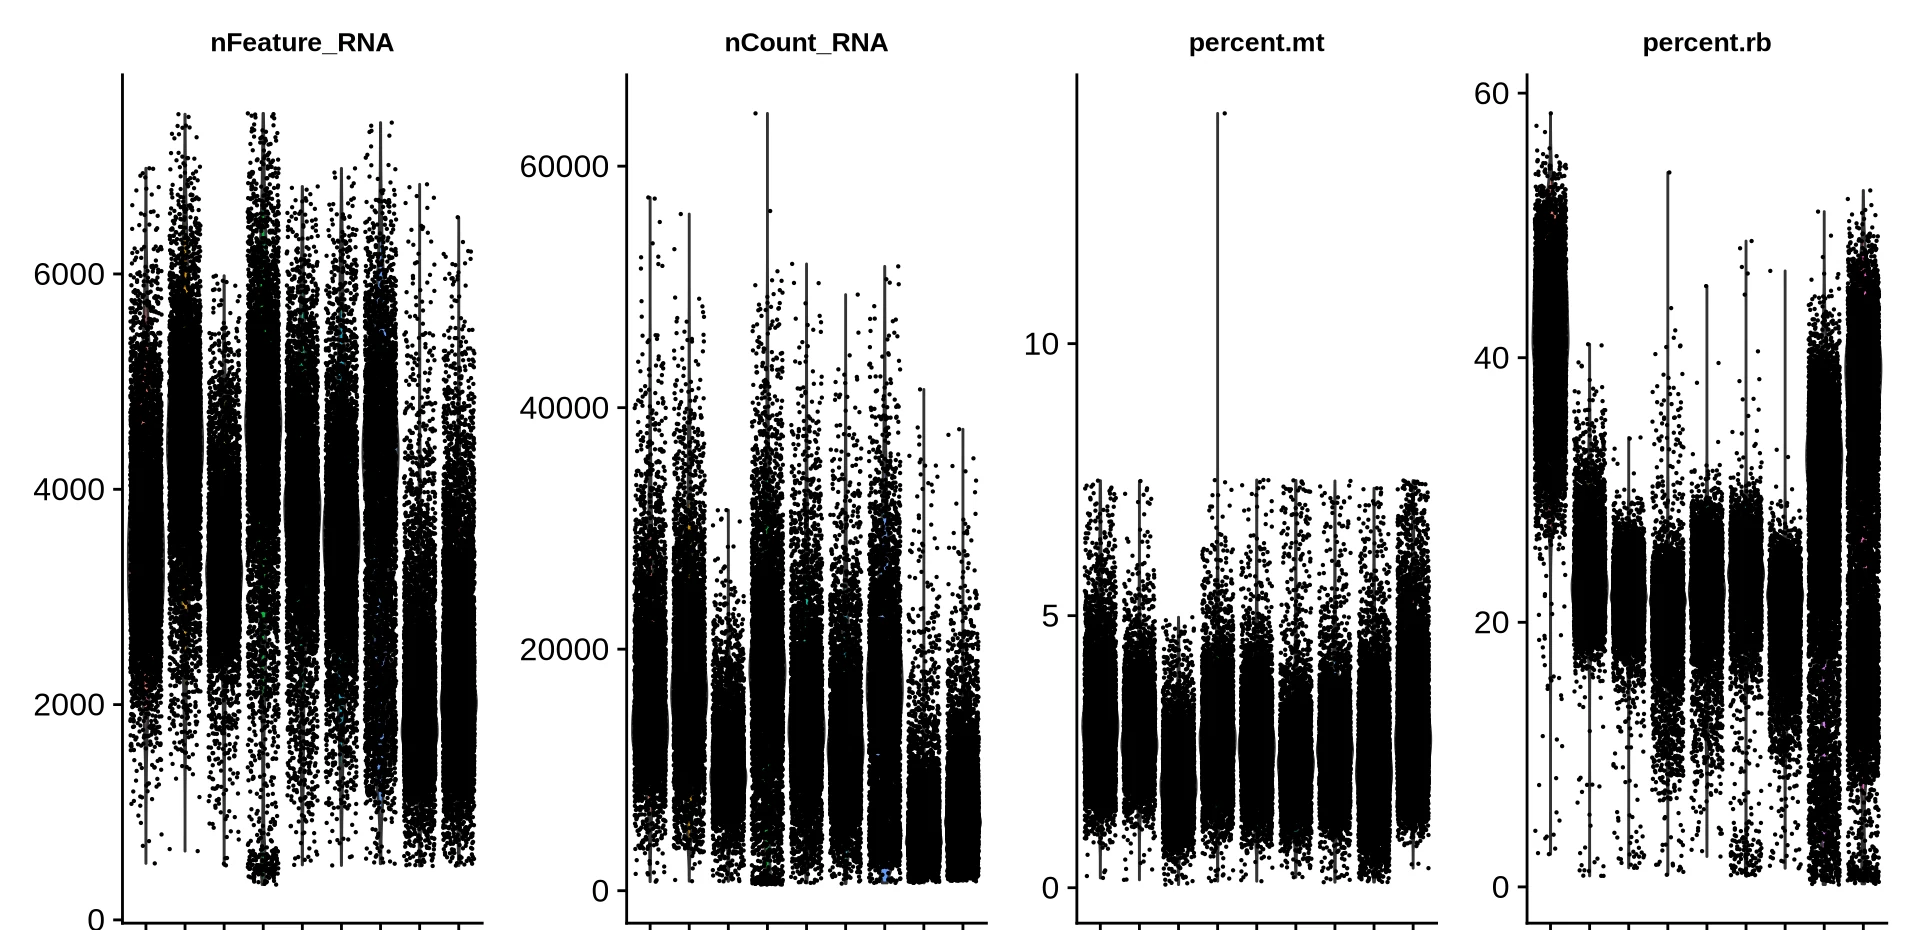
For scRNA-seq, inspect genes per cell, counts per cell, mitochondrial proportion, ribosomal content, doublets, and cell-cycle or stress signals. Thresholds should be explored by tissue and protocol, not copied blindly from another dataset.
# Inspect the distribution of core QC metrics
qc_columns = ["n_genes_by_counts", "total_counts", "pct_counts_mt"]
print(adata.obs[qc_columns].describe())

# Visualize distributions and metric relationships before choosing thresholds
sc.pl.violin(adata, ["n_genes_by_counts", "total_counts", "pct_counts_mt"], jitter=0.25, multi_panel=True)
sc.pl.scatter(adata, x="total_counts", y="pct_counts_mt")
Use the metric names created by your own preprocessing workflow. In Scanpy, mitochondrial percentage is commonly stored as pct_counts_mt.
library(Seurat)

# Add QC percentages; use ^mt- for many mouse annotations
seurat_obj[["percent.mt"]] <- PercentageFeatureSet(seurat_obj, pattern = "^MT-")
seurat_obj[["percent.rb"]] <- PercentageFeatureSet(seurat_obj, pattern = "^RP[SL]")

# Inspect distributions before defining any filtering rule
VlnPlot(seurat_obj,
        features = c("nFeature_RNA", "nCount_RNA", "percent.mt", "percent.rb"),
        ncol = 4, pt.size = 0.1)
FeatureScatter(seurat_obj, feature1 = "nCount_RNA", feature2 = "percent.mt")
Match the gene-pattern regular expression to the organism and annotation used in your dataset; QC variables should be inspected before setting thresholds.
4. Record decisions
Create a QC report that states the metric, threshold, number removed, reason, and whether the decision was made before examining the biological outcome.
metric,threshold,removed,reason
pct_counts_mt,<20,143,high mitochondrial content
Practical Exercise
Choose one assay and create a one-page QC decision table with metric, plot, threshold rationale, records removed, and possible biological bias.
Pass criteria: You can explain at least four QC metrics, state why each matters, and document an exclusion without claiming that one universal threshold is correct.
Troubleshooting
If a sample fails every metric, do not rescue it by repeatedly changing cutoffs. Check sample identity, library preparation, contamination, sequencing depth, and batch before deciding.
Knowledge Check & Assessment
1. Concept Verification
Write short answers explaining the main concepts, the assumptions behind them, and one way a careless workflow could produce a misleading result.
2. Practical Execution
Complete the practical exercise above and save the command, script, table, or figure in the project structure. Pass Criteria: You can explain at least four QC metrics, state why each matters, and document an exclusion without claiming that one universal threshold is correct.
3. Troubleshooting
Explain what you would inspect first if the output were empty, malformed, unexpectedly large, or failed because of a missing file, package, permission, memory, or metadata problem.
Next Steps
Continue with Statistics for Bioinformatics and scRNA-seq Basics. Record the software versions, dataset or example inputs, and any decisions you made.
Reviewed: November 2025
All commands and outputs were verified with the software versions listed in this tutorial. If you encounter reproducibility issues, please report them through the Contact page.
Author: Nasir Mahmood Abbasi, PhD · Category: Foundations & Prerequisites